Viewing and Understanding Your Actual Time Report
Your actual parenting time report uses graphs and charts to show how parents divided caretaking during any period, and how it compared to what was planned.
The data comes from your actual time calendar. It excludes any time the child spent with a third-party caretaker.
Accessing your report
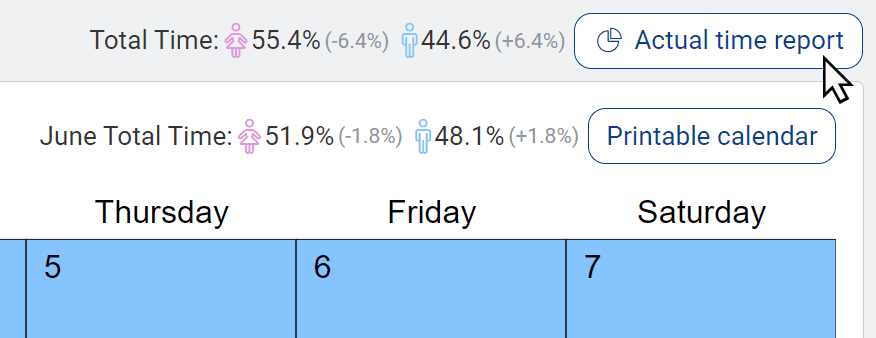
To access your actual time report, click the "actual time" tab.

In the top right corner, you'll see a preview of your actual time data. To see the full report, click "actual time report" (or the pie chart icon on smaller screens).
Choosing a date range
At the top left of your report, adjust your date range to see how it affects your data. Date ranges can have different results, so experiment.

Time versus overnights
Your report measures parenting time two ways: by total time and by overnight visits.
Total time adds up the hours and minutes when a child is in a parent's care. Overnight visits are whenever a child is in a parent's care past midnight.
Some courts prefer one measurement over the other. You might focus on whichever one best illustrates the point you want to make.
To change which shows up on your actual time main page and printable calendar, visit your account settings.
Sections in your report
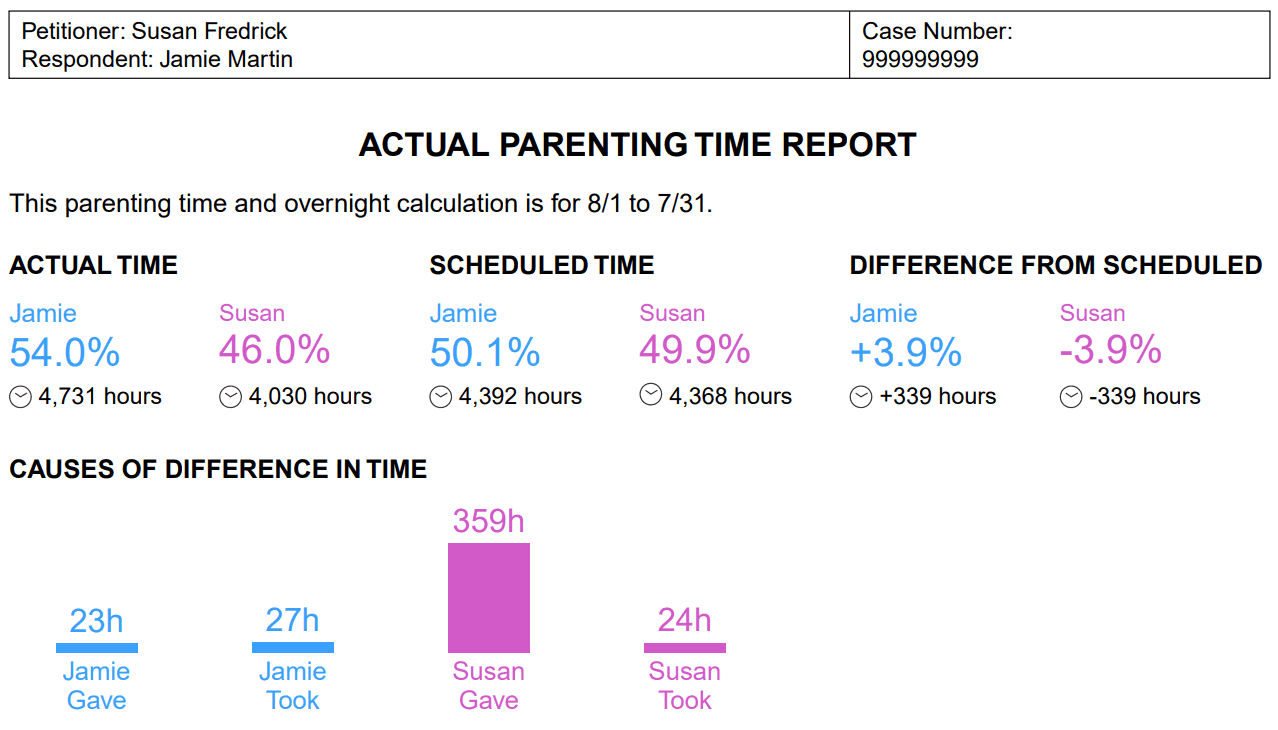
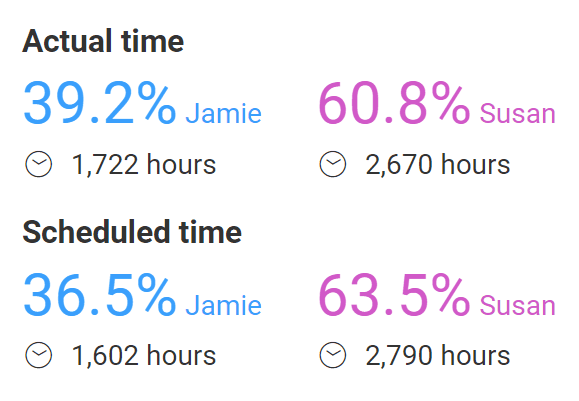
Actual time (or overnights)
These boxes show how much each parent cared for the child during your selected period. They also show how much each parent was originally scheduled to care for the child.
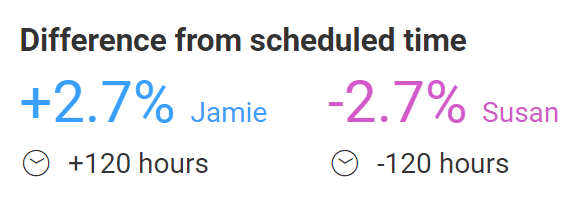
Difference from scheduled time (or overnights)
These boxes show how much parenting time each person gained or lost, compared to what they were scheduled to receive.
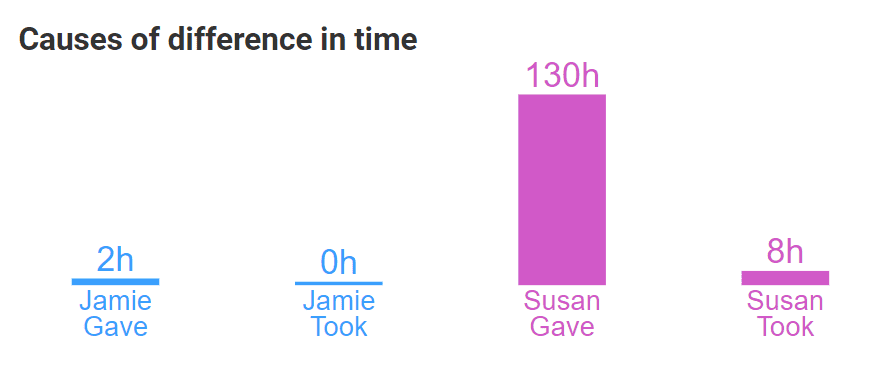
Causes of difference in time (or overnights)
These boxes use a bar graph to show how much time each parent took or gave.
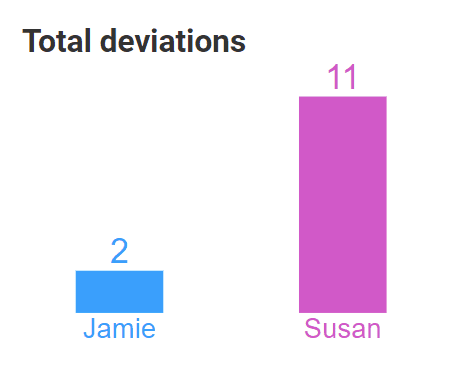
Total deviations
This box shows how many schedule deviations each parent caused.
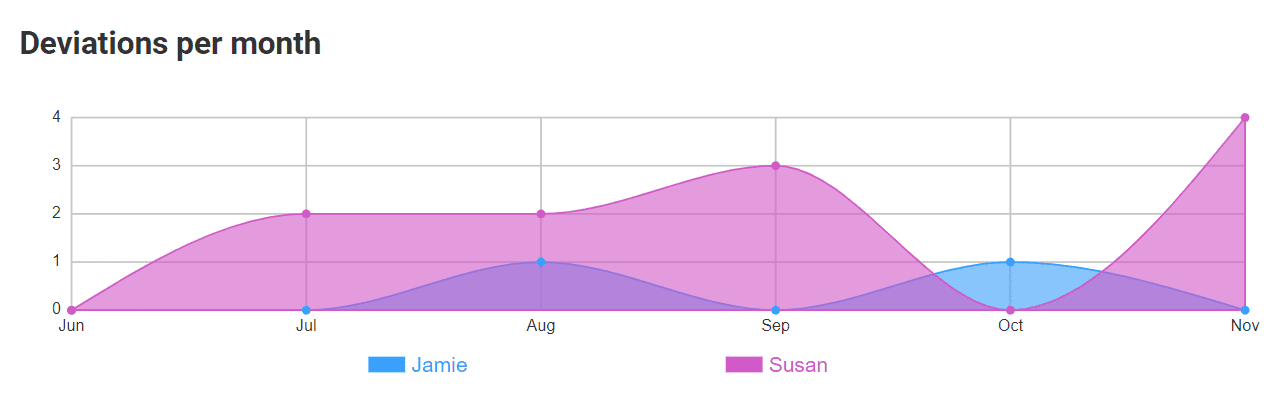
Deviations per month
This box breaks down the data for who caused deviations via a month-by-month graph.
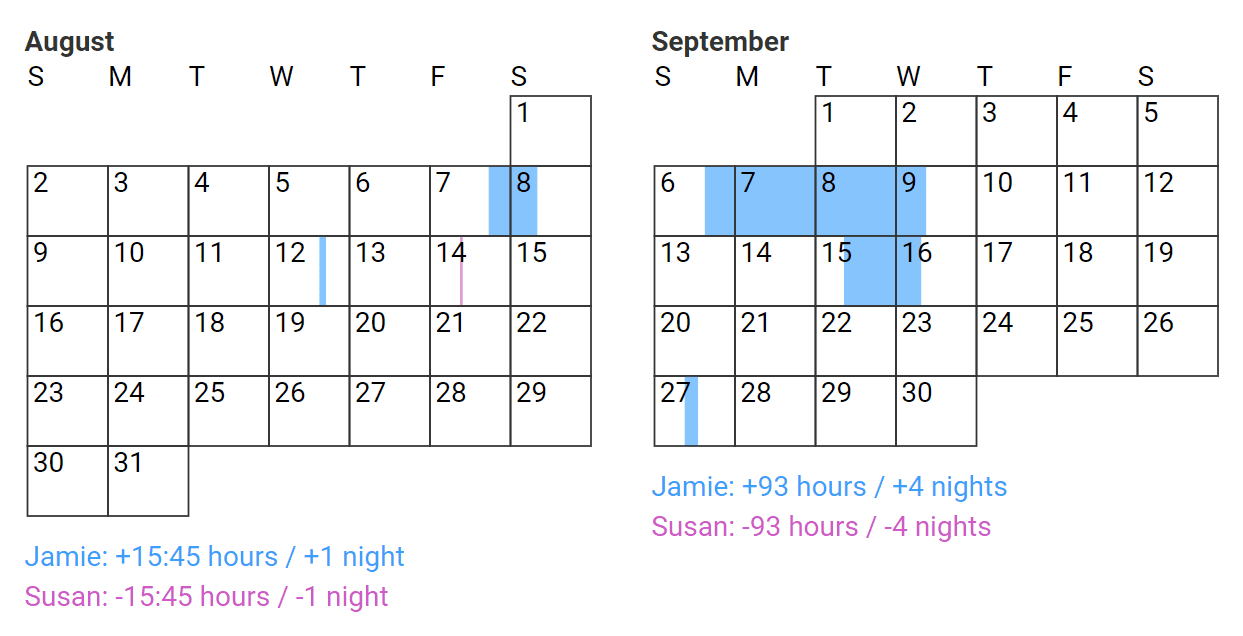
Monthly calendars
The next section shows who got extra parenting time in a calendar view.
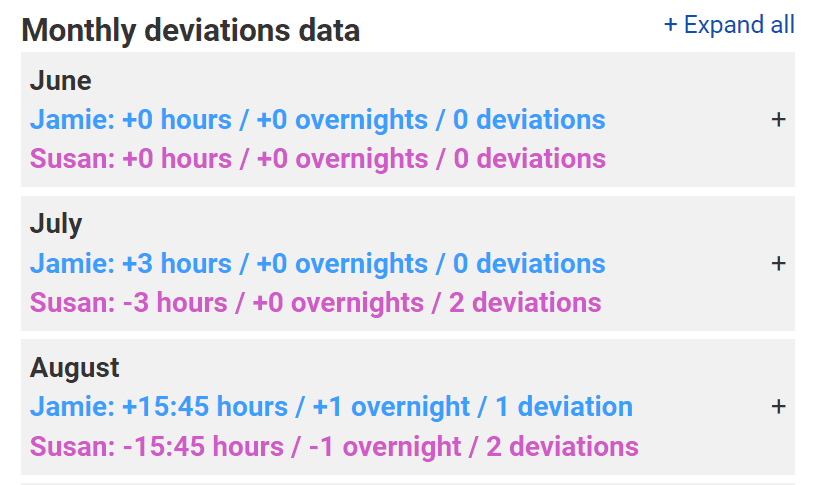
Monthly deviations data
The last section of the report details your monthly data in list form.
Click the plus button to the far right of a month to see the data broken down by each schedule deviation.